Round robin works with a fixed amount of data, and a pointer to the current element. This can be described like a circle with N dots plotted on the edge of the circle. Those dots are the places where data can be stored. The pointer can be described like an arrow from the center of the circle to one of the dots. It shows to the current dot. When the current data is read or written, the pointer moves to the next element. As we are on a circle there is no beginning nor an end, you can go on and on. After a while, all the available places will be used and the process automatically reuses old locations. It is easy to understand that this database will not grow and the file size is always the same.
RRDtool is the OpenSource industry standard, high performance data logging and graphing system for time series data (it uses Round Robin Databases (RRDs)). RRDTool is created by Tobias Oetiker.
For traffic stats, RRD stores the difference in values (between the last value and current) in the database, rather than the value itself. This type of data source is called COUNTER. This type is for continuous incrementing counters like the ifInOctets counter in a router. (assumes that the counter never decreases, except when a counter overflows). It is easy to work with but you will have a problem when routers or modems are rebooted. The counters on the interfaces will be cleared and you will have spikes on your graphs (because the difference between the last value and current is abnormal – for example you will see 100Mbps on 1Mbps link).
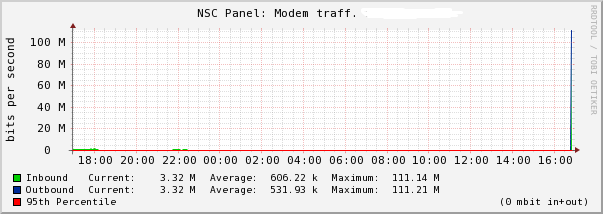
To see what I’m walking about, check the next image

It is noticeable that the only thing we can see on this graph is the spike. Other details are not visible unless we remove this/those spike(s).
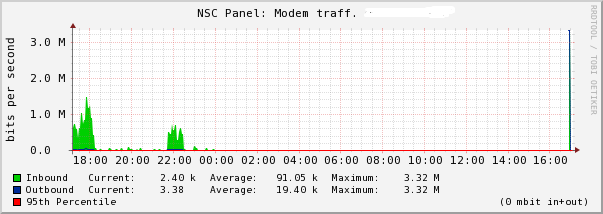
Here is the one solution.
The first thing you should do is to backup your rrd. The second step is to identify data sources used inside the router.rrd file. You can achieve this with next command:
# rrdtool info router.rrd | more |
When you find your data sources, you will need to tune them. (I suppose those DSes are In and Out and we will limit them on 5000000 (5Mbps)
# rrdtool tune router.rrd -a Out:5000000 # rrdtool tune router.rrd -a In:5000000 |
Dump rrd data inside XML file with
# rrdtool dump router.rrd > fix.xml |
And delete router.rrd file
# rm -fr router.rrd |
Then import data from XML file in new router.rrd
# rrdtool restore fix.xml router.rrd -r |
That’s it.
The graph is OK now.

As you can see, the spike is limited to 5Mbps. You can decrease this limit to less then 5000000 if you don’t expect values above 5Mbps.
I suppose you already know how to generate graphs. If you don’t know how check rrdtool tutorial or leave a comment and I’ll write a small article about it.

Excellent work! Thanks!
Definitely works and helps so much…
thanks 🙂
And with lot of rrd (if rrd name match bytes):
for i in `ls *_bytes_*.rrd`; do rrdtool dump $i > /usr/src/rra/$i.xml; rm -f $i; rrdtool restore /usr/src/rra/$i.xml $i -r ;echo $i; done
Hi,
Just want to ask, how about if the monthly and yearly graph displays negative values?
-500MB and -50MB.?
Thanks.
Jay
It shouldn’t be possible to add negative values inside traffic graph.
Hi,
Sorry to confused, but what i mean is, my monthly and yearly graph now is showing negative values, this happened 2 weeks ago.:-). I am new in mrtg, just don’t know what do i need to do to fix this. Thank you so much.
Jay
Hi,
I have manged to delete negative numbers (I had a % range, and the negative % made the graphs not usable )
80% of the time the removespike.pl works a treat.
If you still have a broken graph, vi the fix.xml before you restore it. I noticed that some of the lines had a negative number in it. I delete this line, and my graphs all came back. An example of such a line is below
-6.8114659491e+01 -7.1465422454e+01 -7.8105256597e+01 7.6279159028e+01 </row
Another option is to leave the data as is, and compute the 95 percentile. Then apply this 95 percentile to limit the graph in height.